Turning scattered campaign exports into a single source of truth
TL;DR: A Google Sheets dashboard that unified paid and influencer campaign data across every game title, region, and channel. It revealed ways to improve our performance and shifted strategy in a major way.
"This might be the best Google Sheet I've ever seen" - Senior Data Analyst on the PlayStation Esports team.
The problem
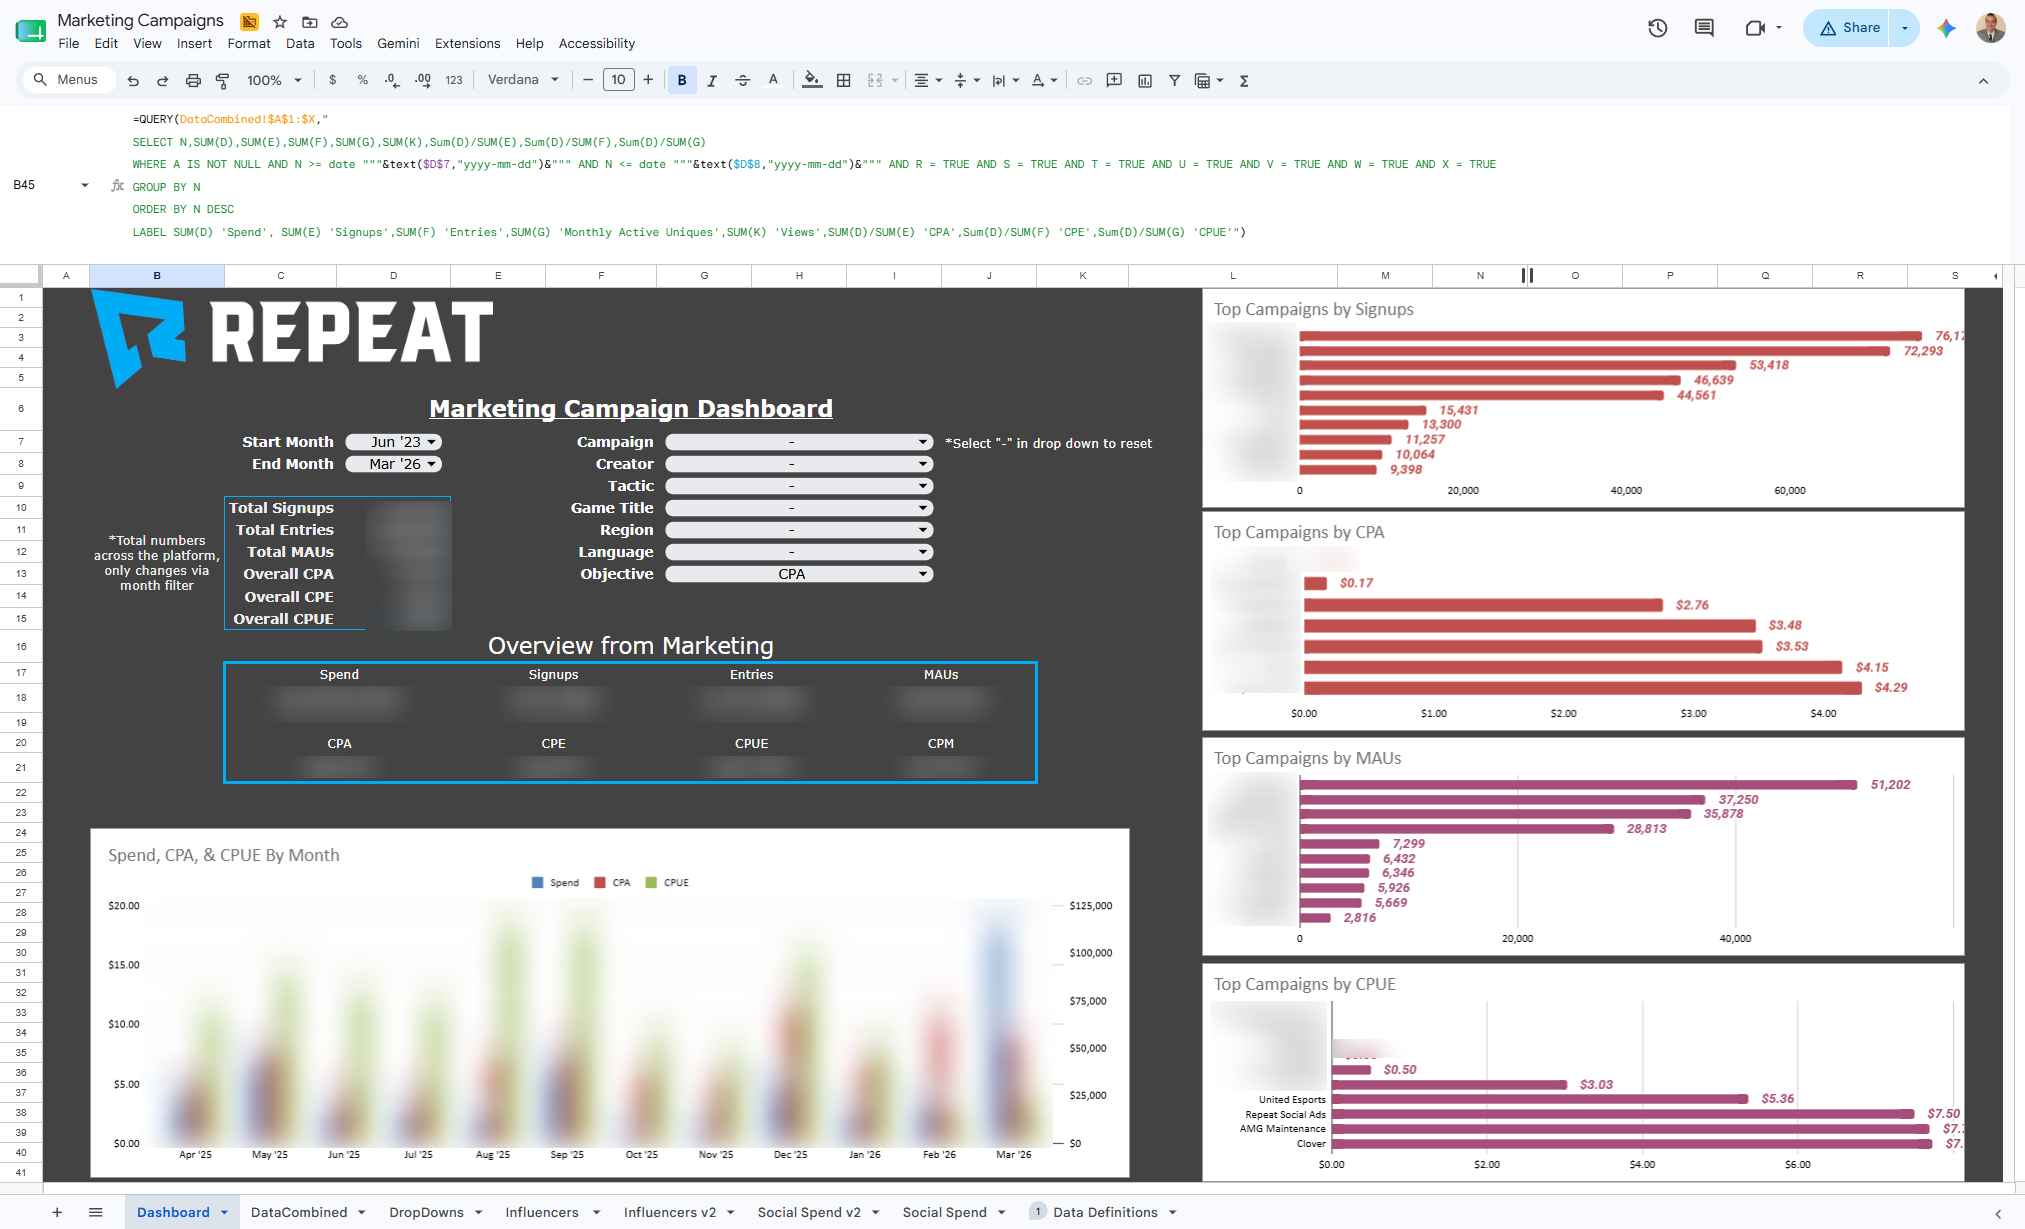
Repeat ran marketing — Google Ads, Social ads, YouTube integrations, dedicated creator content, Twitch streams, Discord, TikTok — across a growing catalog of game titles with reporting being done mostly adhoc and individually per channel.
There was no single view of what was actually working. Budget decisions were made channel by channel, campaign by campaign, without a way to compare creators or channels across regions or languages, as one example.
What I built
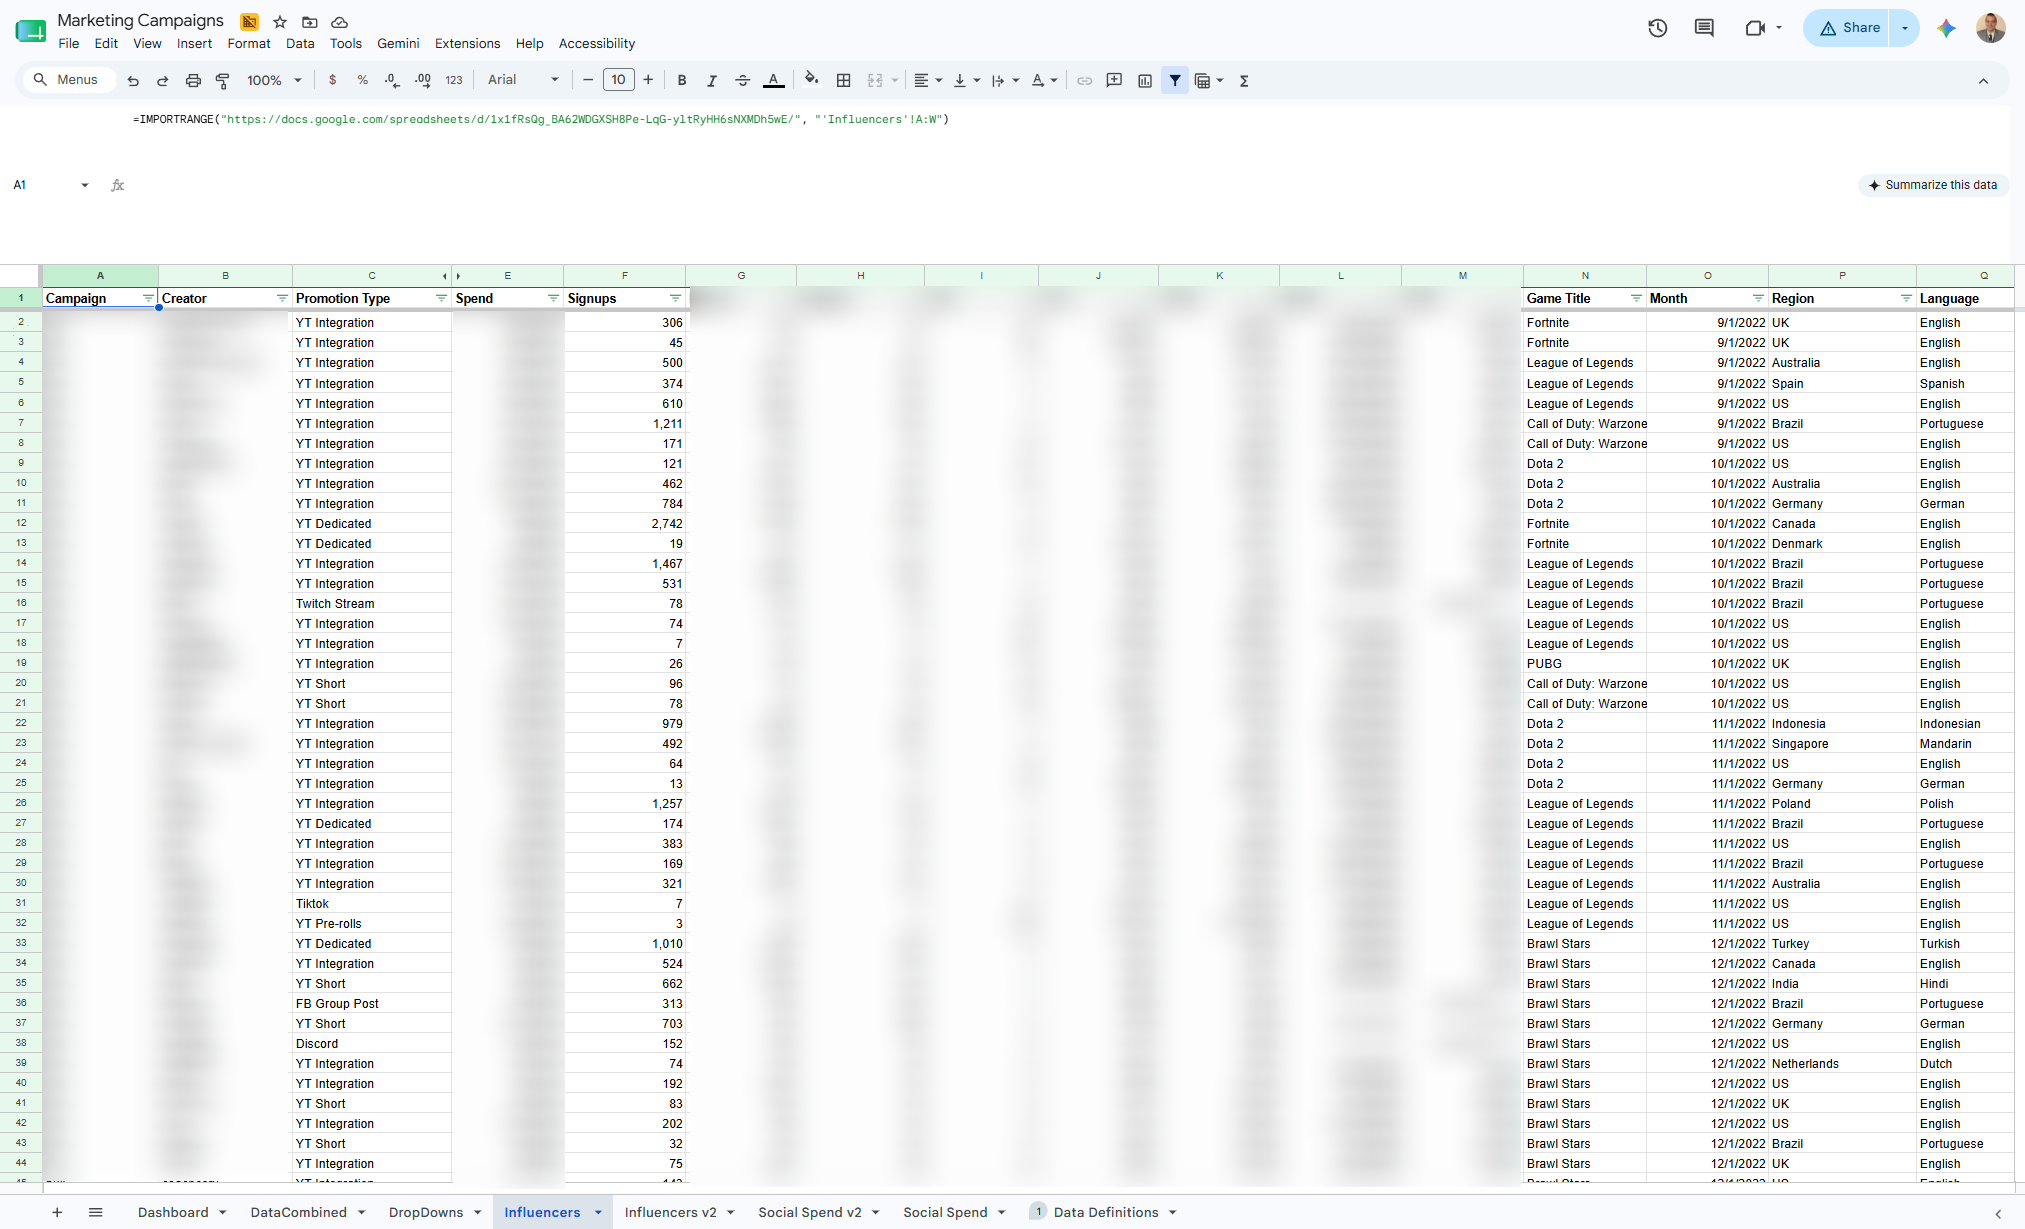
I built a central database that pulled every export in automatically via IMPORTRANGE, then layered nested QUERY formulas on top to aggregate spend, signups, entries, and monthly active uniques into CPA, CPE, and CPUE on demand. We were already doing this for each channel individually, but this dashboard showed everything together and automated it so updating data took 15 minutes.
No pivot tables. The entire dashboard runs off QUERY output, which meant every chart stayed live the moment a new export landed in the database tab.
SELECT N,SUM(D),SUM(E),SUM(F),SUM(G),SUM(K),Sum(D)/SUM(E),Sum(D)/SUM(F),Sum(D)/SUM(G)
WHERE A IS NOT NULL AND N >= date '"&text($D$7,"yyyy-mm-dd")&"' AND N <= date '"&text($D$8,"yyyy-mm-dd")&"'
AND R = TRUE AND S = TRUE AND T = TRUE AND U = TRUE AND V = TRUE AND W = TRUE AND X = TRUE
GROUP BY N
ORDER BY N DESC
LABEL SUM(D) 'Spend', SUM(E) 'Signups',SUM(F) 'Entries',SUM(G) 'Monthly Active Uniques',SUM(K) 'Views',SUM(D)/SUM(E) 'CPA',Sum(D)/SUM(F) 'CPE',Sum(D)/SUM(G) 'CPUE'")
)
What the data showed
Three distinct patterns (among others) became visible and informed strategy for future decisions.
Micro-influencers outperformed macro
Creators with smaller, more dedicated audiences consistently posted better CPAs than larger-reach influencers — shifting how partnerships got prioritized.
Spend followed the player
Google Ads spiked during peak gaming hours and around high-visibility campaigns. We then tailored our "always on" marketing spend to match those windows instead of running flat.
Region audience trends were revealed
Certain titles outperformed in certain countries. Influencer targeting shifted to match creator location with the games actually resonating there.